Data Analytics Services That Survive Past the Launch Dashboard
Aipxperts fixes the data layer first, defines each metric once, then builds the reporting and prediction on top of that single definition. Our data analytics services exist to make the number in your Monday meeting stop being arguable.
Book a Data Assessment 5.0
5.0 5.0
5.0 4.3
4.3 4.8
4.8Where Our Data Analytics Services Start, and Why It Is Not the Dashboard
Most analytics programmes stall for one reason and it is never the chart library. The data layer underneath was never fixed, so reports disagree, definitions drift between departments, and nobody trusts the number in the meeting.
Our engineers audit the source systems before anybody promises a timeline. Then metrics get defined once, in a governed model, with an owner, a formula and a grain. Only after that does the reporting layer go on top, and that sequencing is what decides whether a dashboard is still in use a year later.
The same discipline applies whether the work is a Power BI rollout or a demand forecast running in production. What changes is the scope, not the order the work happens in.
Some have three departments reporting revenue three different ways and a meeting every month about which one is right. Some have dashboards nobody has opened since the launch demo. Some have the data and no way to get a question answered without asking an analyst who is already at capacity. Aipxperts starts all three at the definition rather than at the chart, because that is where the disagreement actually lives.
The pipeline and platform work underneath this is data engineering, and custom models on top of the analytics layer are AI development.
The Firm the Analysts Sit In
Analytics work is trusted or ignored depending on who stands behind the numbers. This is the organisation behind these.
100+
Software Engineers
500+
Solutions Delivered
30+
Industries Served
95%
Client Retention
120+
Clients Worldwide
3
Unicorn Products
The Data Analytics Services We Deliver, Each Available on Its Own
Every one of these data analytics services can run standalone, and most engagements combine two or three. The order they appear in is roughly the order they should happen in.
Business Intelligence and the Metric Layer
Before a single chart gets built, our analysts give every metric one agreed definition with a named owner. The governed layer then goes into Power BI, Tableau or your existing tool on top of it, and you keep a versioned metric catalogue with formula, filters, grain and owner per measure.
Warehouse Modelling for Reporting
An existing warehouse remodelled by our analysts for reporting: dimensional structure, grain, and the schema-change process that keeps a dashboard from silently breaking. The artefact is the model itself plus a documented process for changing it.
High-Volume and Event Data
Where the volume breaks a conventional warehouse, our engineers design the storage and partitioning for event, telemetry and clickstream data, with query cost modelled per dashboard rather than discovered on the first bill. What this is not is event streaming: loads run in batch or micro-batch, and a sub-second requirement gets referred out rather than accepted.
Data Visualisation
Dashboards shaped by our analysts around the decision they support rather than the data that happened to be available, with drill-downs, alert thresholds and mobile views. The specification ties every view to the decision and the person who makes it.
Analytics Modernisation
Ahead of any cutover, we map every existing report and the logic underneath it, then run legacy and new in parallel through a validation window. The reconciliation log is signed off report by report before anything is switched off.
Forecasting and Planning Analytics
Demand, inventory and supplier performance models built by our data scientists across your operational data, with retraining triggers and drift thresholds defined before the first model reaches production. Forecast accuracy is reported per category and reviewed against the plan each cycle.
Analytics as a Service
Where you need the function without a permanent hire, we run pipelines, dashboards and model refreshes on a fixed monthly scope with a named analyst, adjustable each quarter. The scope document lists the hours, the deliverables and the analyst by name.
The Number That Was Arguable, and What Settled It
Look for what the business could measure afterwards that it could not before. If that line is thin, the engagement produced dashboards rather than answers.
FinTech
A NIFTY Stock Return Calculator That Handles Splits and Dividends Automatically
Ask what a holding in an Indian stock is worth today and the arithmetic looks trivial, until splits and dividends enter it. Sixteen calculators, and the hardest one adjusts for both automatically.
Read case study: A NIFTY Stock Return Calculator That Handles Splits and Dividends AutomaticallyMarketplace
Keeping Marketplace Deals Moving After the Buyer Closes the Laptop
A services marketplace runs on conversation, and conversation stops when the buyer closes the laptop. Chat, order completion and web-login approval moved onto the phone in one Flutter codebase.
Read case study: Keeping Marketplace Deals Moving After the Buyer Closes the LaptopDepartments That Stopped Disagreeing
The people who commissioned this work describe it in their own words, on platforms that verify the engagement before the review is published.

Hardik was very helpful in advice and completing the work.

We have contracted a developer from Aipxperts now for several months, based on a referral. We have been very pleased with the quality of the work, the knowledge and skill level of our developer, and the value we're receiving for our fee. We also very much appreciate that the development team works at night (effectively), so we are sometimes able to turn client requests around in a day.There have been a couple of situations where we needed urgent help outside of our developer's normal business hours, and we've received that help (for which I am very grateful). While we have some challenges with communication sometimes, our overall satisfaction level is very high.
The Sector Data Model Behind the Metric That Matters to You
The metric that decides things changes completely by sector, and so does what data analytics services have to model, and so does the model underneath it. Each one names the model our analysts bring and the decision it feeds, because a generic template applied to your sector is how analytics projects produce dashboards nobody opens.
Retail
Stock position, sell-through and margin by location, reconciled between point of sale, inventory and purchasing. The useful measure is rarely revenue. It is what a store should order on Thursday, and we get three systems agreeing to the hour before retail reporting means anything.
eCommerce
Contribution margin after fulfilment, returns and acquisition cost, rather than gross revenue. Our model carries the returns lag explicitly on eCommerce work, because a category that looks profitable in week one frequently is not by week six.
Logistics and warehousing
Cost to serve per route and per customer, reconciled between carrier invoices, warehouse events and the order record. The useful measure is which lanes lose money, and no single system holds enough to answer it, so our model joins all three on logistics work.
Mobile games
Retention curves, session economics and in-app conversion by cohort, where the decision is what to change in the next live-ops cycle. Our model separates the cohort effect from the change effect on mobile games, which most dashboards conflate.
On-demand platforms
Supply and demand density by time and area, because the operational decision is where to incentivise on Friday evening. The measure that matters is unfulfilled demand, which by definition is not in your transaction data, so we model it from what surrounds it on on-demand platforms.
Health and fitness
Habit formation and lapse risk rather than raw sign-up counts, with device data quality modelled alongside, since gaps in it look identical to genuine inactivity and are usually why a health and fitness retention model misfires. Our analysts model the device data quality alongside the behaviour.
Fintech
Portfolio, risk and reconciliation reporting where a figure has to be defensible to a regulator rather than merely useful to a manager. We treat lineage from source to report as mattering as much as the number itself on fintech work.
What to Check Before Shortlisting an Analytics Partner
Each request is cheap to make and separates suppliers faster than a portfolio does. Apply them to every bidder, us included.
01Ask who owns each metric definition after handoverIf the answer is the vendor, your reporting has a dependency you did not agree to. We hand the catalogue over as yours, with a named owner inside your business against every measure.
02Ask what the source audit found before the timeline was quotedA delivery date issued before anybody profiled the data is a guess wearing a Gantt chart. Our engineers profile first and quote second, which occasionally makes us slower to respond and rarely wrong afterwards.
03Ask what happens when a model driftsRetraining triggers, drift thresholds and who gets alerted are the whole difference between a working system and a demo. We define them before a model goes near production.
04Ask which dashboards from two years ago are still in daily useAdoption decays and every vendor knows which of theirs decayed. We track usage after launch and remove what nobody opens, because a dashboard estate nobody prunes becomes an estate nobody trusts.
05Ask what they will not take onWe build the analytics layer and the models on top of it. Running your data platform day to day, patching it and holding the on-call is a different engagement, and there is no staffed overnight rota here.
How a Metric Gets Defined, and Why Departments Stop Disagreeing About It
Almost every reporting argument is a definition argument wearing a data costume. Here is what our analysts actually do to end one, using the measure most businesses fight about.
Start with the disagreement rather than the dataFinance, sales and operations each have a version of revenue and each is right within its own frame. We get the three definitions written down side by side, which usually takes an afternoon and is the part most projects skip.Name the grain, the filters and the ownerPer what, over what period, excluding what, owned by whom. A metric without a named owner drifts within two quarters, because somebody will need a variant and nobody will be responsible for saying no.Put it in the model, not in the dashboardDefined once in a governed layer that every tool queries. A definition living inside a Power BI file is a definition that gets copied and edited, which is how three versions appear again.Publish the variants deliberatelySome businesses genuinely need net and gross versions of the same measure. Those get named, defined and published as separate metrics rather than argued about as the same one under different filters.
The Platforms Our Analytics Engineers Build On
What our data engineers and analysts work across, from warehouse through transformation to the reporting tool your business already uses. We scope against the licences you hold before proposing anything additional, because most estates are already paying for more than they use.
Warehouses and query engines
Where the dimensional model lands and what the reporting layer queries. Choice follows your existing cloud contract and licences before anything else.
 Google BigQuery
 Snowflake
 Amazon Redshift
 Azure Synapse
 Databricks
 PostgreSQL
 Microsoft SQL Server
 ClickHouse
 Trino
Trino
Pipelines and transformation
How data gets in, gets cleaned, and gets tested. Transformations are version-controlled and tested like application code, because a silent transformation bug is the hardest analytics failure to find.
 dbt
dbt Apache Airflow
 Apache Spark
 Apache NiFi
 Airbyte
 PrefectDelta Lake
 Python
Business intelligence and reporting
Where your users actually work. In most engagements the tool stays and only the layer underneath it changes.
 Power BI
 Tableau
 LookerSisense
 QlikLooker Studio
 Apache Superset
 Metabase
Modelling and machine learning
For the forecasting and classification work that sits on top of the warehouse, with experiment tracking so a result can be reproduced months later.
Python scikit-learn
 Pandas
 NumPy
NumPy MLflow
 TensorFlow
 PyTorch
 Amazon SageMaker
 R
R
Monitoring and explainability
Pipeline health, drift detection and the artefacts that let a stakeholder interrogate an individual prediction.
 Grafana
 PrometheusMLflowSHAPLIMEGreat Expectations
Cloud and delivery
Where it runs and how it is deployed, inside your own cloud account wherever your architecture allows.
Amazon Web ServicesMicrosoft Azure Google Cloud
 Docker
 Kubernetes
 Terraform
 Amazon S3
Dashboards Still Open Two Years Later
On analytics work the review worth looking for is from a client whose dashboards are still open two years later. Launch enthusiasm is easy and adoption is not.
Access, Governance and Independent Evidence on Analytics Work
Analytics work needs access to everything at once, which is precisely what makes governance the question worth settling before the first extract runs.
Where your data sits during the workInside your own environment wherever the platform allows it. Where an extract is genuinely required, it is masked or subset, scoped to the tables named in the agreement, and deleted on schedule rather than when somebody remembers.Lineage and definition governanceEvery published metric carries its lineage from source to report, which is what lets a disputed figure be traced rather than re-argued. Where a regulator will see a number, that trail is part of the deliverable.Access, and why read-only is enoughNDA before any access. Credentials scoped to the named engineers, granted through your identity provider where possible, and revoked at close with the revocation recorded.The two certifications this firm does not holdNo ISO 27001 or SOC 2 is held here. Our governance work produces the control evidence auditors accept, and where a certified supplier is a hard requirement we would rather you knew now.
How an Analytics Engagement Runs, and What Gets Settled at Each Stage
Each stage names the argument it ends, because on data analytics services the deliverable is usually agreement rather than software.
01Source audit and data profilingWhat exists, where it disagrees, what is missing, and how bad the quality actually is, established by our analysts before anybody quotes a timeline. It settles whether the reporting problem is a reporting problem at all, which about half the time it is not.02Metric definition and governanceEvery measure defined once, with formula, grain, filters and a named owner inside your business. We end the monthly argument about whose revenue number is right.03Model and warehouse designDimensional model, incremental loads and a documented process for changing the schema without breaking every report downstream. Our engineers settle whether the estate can grow without a rebuild, which is decided here and discovered two years later.04Pipeline build and validationIngestion and transformation with reconciliation against source, built by us so a broken feed surfaces the same day rather than at month end. What it settles is how long a data quality problem stays invisible.05Reporting and dashboard buildViews we build around decisions and the people who make them, with alert thresholds where a decision is time-sensitive. The question it answers is whether anybody opens it after the launch demo.06Parallel running and reconciliationOld and new reporting run together through a validation window, with outputs reconciled by our team report by report. It settles whether institutional reporting logic survived the move, which is the risk nobody prices.07Adoption review and handoverUsage measured, unopened dashboards retired, and the metric catalogue and documentation transferred to your team. We settle whether you own the reporting or merely receive it.
Asked Before Commissioning Analytics Work
Reporting projects rarely fail technically. They fail because nobody agreed what a number meant, and several of these are about that.
Share your project vision
Tell us what you want to build. A specialist, not a salesperson, replies.
Tell Us Which Number Your Leadership Team Argues About
Send us the report three departments disagree with, or the dashboard nobody has opened since launch. Back comes what the source audit would look at, where the definitions diverge, and an honest note if the problem turns out to be a process rather than a platform.
Send Us the Number You Argue AboutWritten While Fixing Data Layers
Our engineers and consultants write up what they learn on live projects: architecture decisions, model evaluation results, and the trade-offs behind them. Written for the people who will implement them.
-
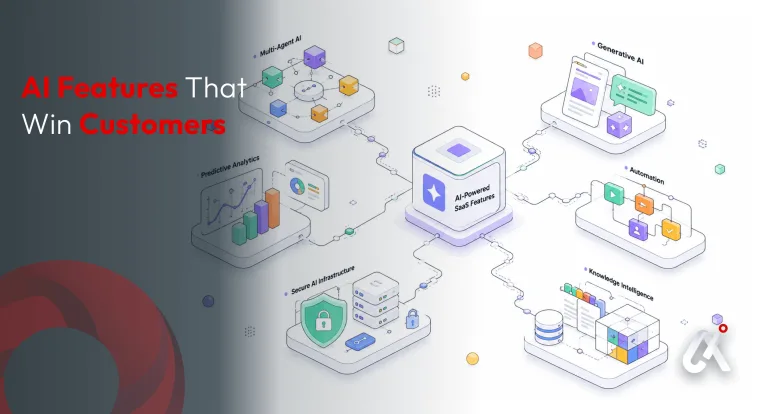
AI SaaS Features That Differentiate Your Product in 2026
The Software-as-a-Service (SaaS) industry in 2026 has crossed a critical threshold
-
Generative AI App Development: Transforming Web and Mobile in 2026
For forward-thinking CTOs, product managers, and enterprise decision-makers, staying competitive requires shifting away from legacy static architectures
-
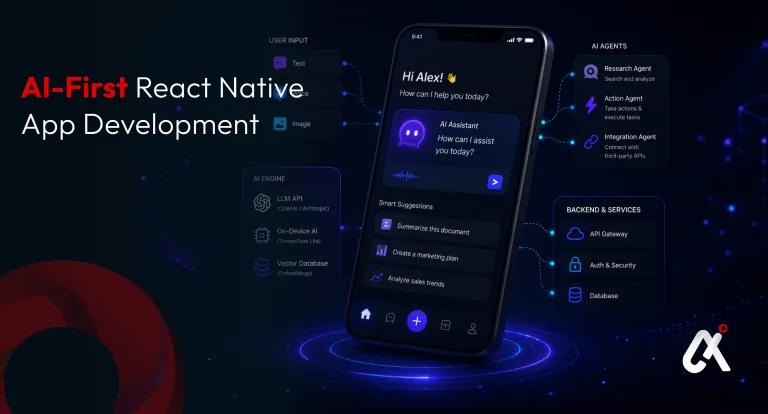
React Native AI: Building an AI-First Mobile App in 2026
A practical guide to AI-powered churn prediction, retention automation, and personalization for two-sided marketplace platforms